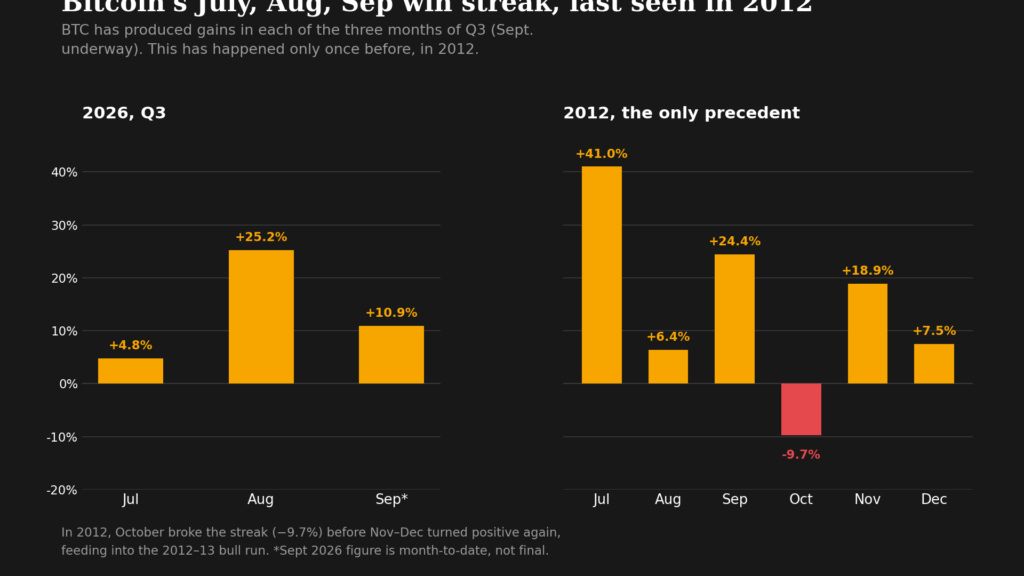
Bitcoin has secured positive returns across July and August while tracking toward a higher finish in September, creating a three-month consecutive winning streak that has only materialized one prior time throughout the digital asset’s history.
Analytics provider CoinDesk reported that Bitcoin’s valuation climbed 4.8% during July and jumped 25.2% over August. September maintains its upward momentum as well, with tokens changing hands 10.9% higher at $86,140 as of this publication.
The sole preceding occurrence happened back in 2012 when valuations advanced by 41.0%, 6.4%, and 24.4% during those respective months.
Following that, October disrupted the streak as Bitcoin dropped 9.7% over the course of the month. However, the correction found its floor at $10.17 on October 26, serving as the launching pad for one of the most explosive rallies in Bitcoin history—a 165-day surge driving prices to $230 by April 2013, representing an expansion exceeding 2,000% based on CoinDesk’s evaluation of daily pricing records.
Determining whether the current year mirrors that trajectory—featuring a negative October preceding a massive bull run—or diverges completely cannot be definitively answered by the 2012 precedent alone because the available sample size remains exceedingly small. Bitcoin has been actively traded since at least late 2010, yet this exact configuration has only manifested once. Consequently, insufficient repetition exists to formulate a conclusive outlook regarding subsequent movements.
Nevertheless, the current market alignment commands attention due to its extreme scarcity, the massive expansion succeeding the 2012 precedent, and Bitcoin’s broader four-year valuation cycle. Several cycle frameworks suggest a potentially constructive phase commencing around October or November, although historical cycle patterns function as general approximations rather than rigid calendar laws.
Furthermore, the scale of any potential surge might prove more modest compared to Bitcoin’s formative years. Back in 2012, Bitcoin operated as an obscurely traded instrument valued barely at $10, meaning its marketplace could be heavily influenced by a minimal group of participants.
In contrast, Bitcoin presently constitutes part of a multi-trillion-dollar marketplace featuring deep institutional involvement, robust spot and derivatives liquidity spread across numerous trading platforms, alongside an extensive variety of directional and relative-value instruments encompassing options, futures, and basis trades. Those financial structures lacked comparable scale back in 2012, presenting substantial hurdles to replicating a percentage-based rally of similar magnitude today.
Vikram Subburaj, CEO of the India-based exchange Giottus, shared his perspective on the data by stating, “Bitcoin now belongs to a global asset class with institutional ownership. Spot ETFs have created a regulated channel for investment. Derivatives markets have changed how risk is transferred. The rally of more than 2,000% that followed the 2012 sequence cannot become a reasonable expectation for 2026.”
He elaborated that the prevailing market architecture differs fundamentally and relies on institutional backing.
He further observed, “The real change is therefore one of market structure. Bitcoin’s rise in 2012 began in a market that could be transformed by a small pool of buyers. The case in 2026 depends on whether large pools of capital continue allocating after the easiest gains have been made.”
Institutions have clearly gravitated back to the cryptocurrency sector, judging by U.S.-listed spot ETFs acting as a reliable barometer. According to metrics from SoSoValue, these financial products have attracted in excess of $5.5 billion in investor capital starting from August.
Subburaj emphasized, “The durability of those allocations matters more.”
History often rhymes
Nicolai Sondergaard, Senior Research Analyst at Nansen, noted that while history avoids exact repetition, it frequently rhymes, alluding to the unusual technical configuration alongside four-year market cadences.
Sondergaard conveyed to CoinDesk, “We always look for patterns, and Bitcoin has, for better or worse, continued to adhere to the 4-year cycle. Sometimes slightly late, sometimes early, so it is not unsurprising that we see certain patterns play out again and again (to a certain degree, of course).”
Sondergaard added, “It is not a guarantee that we will now see a red October, but it wouldn’t be surprising to see some drawback (not a wild new low) but some drawback in the coming weeks given how the market has been performing.”
Lacie Zhang, research lead at Bitget Wallet, argued that the true significance stems less from historical formations and more from the underlying catalysts this time around, specifically institutional capital entering via ETFs, which might sustain supply absorption through the fourth quarter even after the short squeeze loses momentum.
She emphasized, however, that macroeconomic forces could still exert substantial influence.
Zhang noted, “The main counterweight remains macro conditions, with the Fed raising rates to 3.75%–4.00% and signaling that another hike could follow this year. Whether spot inflows remain positive after the squeeze fades will therefore be a more useful signal of durability than the calendar pattern itself.”
Originally published at https://www.coindesk.com/markets/2026/09/23/bitcoin-s-on-a-streak-it-hasn-t-hit-since-2012.