Cryptocurrency participants are starting to reference the “Bart Simpson” setup—the spiky-haired animated character from “The Simpsons”—after a prolonged absence.
The catalyst? Bitcoin BTC$79,679.08, XRP (XRP), ether ETH$2,454.78, alongside several others, are shedding value and giving back recent sharp gains in a progression that heavily mirrors Bart’s spiked hairstyle, which shoots vertically upwards before plunging steeply downward. It has been a minimum of three years since the bitcoin Bart Simpson Pattern, originally named back in 2015 by former X user @whaleclubco when BTC sat at $229, was last brought up.
Chart spotters spotted the formation on September 1, reigniting discussions across crypto X. Ben Cowen, market strategist and head of Into the Cryptoverse, pointed out to his 1.2 million followers on X that this pattern appeared to be developing.
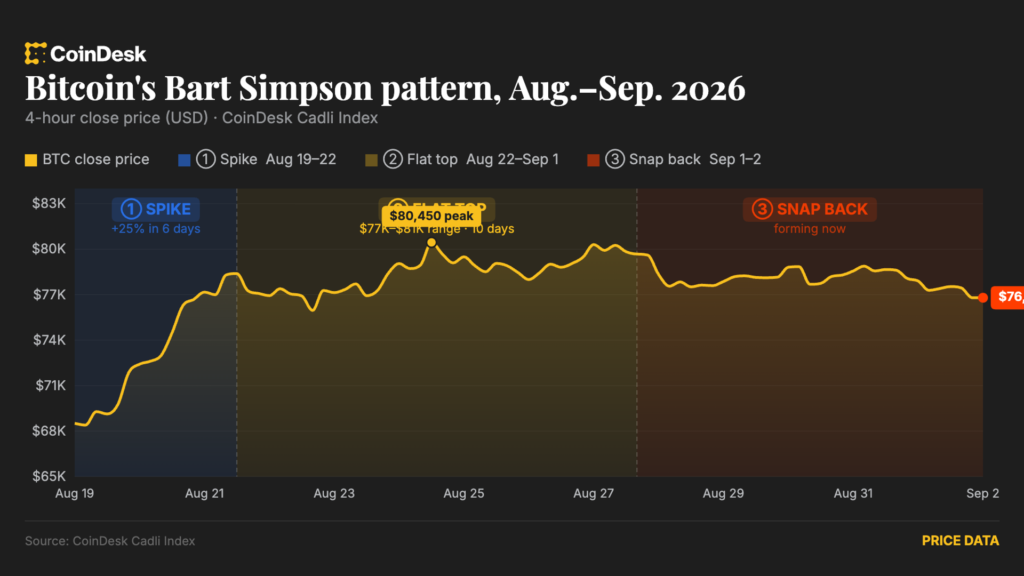
This formation consists of three distinct stages. First comes the Spike, representing an abrupt and aggressive upward or downward price leap occurring fast enough to lure retail investors into chasing the momentum. Following that is the Flat Range, or the head, where prices consolidate horizontally inside a narrow channel while trading volumes typically fade. Finally comes the Snap Back, marking a violent reversal heading opposite the initial Spike. Combine all three, and the outline of Bart Simpson materializes right on the price graph.
The Spike phase kicked off on August 19, when BTC traded near $64,420. By August 21, the valuation of bitcoin climbed nearly $14,000 to approximately $78,300, eventually running into resistance just under $80,700 on August 25. At the time of writing, bitcoin hovered close to the $76,500 threshold, per CoinDesk figures.
Observed on a chart, that very same price action looks unmistakably like Bart Simpson taking shape, with the concluding snap back currently playing out.
Feedback across X remains divided. Numerous market participants doubt the pattern will fully materialize, anticipating bitcoin to sustain its upward trend, whereas others regard a potential correction as an accumulation opportunity ahead of the upcoming bull run.
Should Bart Simpson completely materialize, the price of bitcoin would pull back by a minimum of 20%, stated Mati Greenspan, head of Quantum Economics and prior eToro senior analyst. Nonetheless, Greenspan noted he remains skeptical that this will occur.
“It’s only a Bart Simpson if it falls 20%,” Greenspan remarked, emphasizing that this setup served as a defining characteristic of bitcoin’s shallower and less mature markets.
“I can’t remember seeing a clean one in years,” he stated, “though they could still happen. Yet as liquidity, market depth alongside institutional participation have grown, they seem to have quietly disappeared from regular bitcoin price movements.”
Bart Simpson formations are not restricted solely to bitcoin, Greenspan explained, adding that the narrative differs entirely regarding XRP.
“Considering XRP’s near-vertical surge moving from roughly $1 to $1.70, the setup is definitely present. If it retraces sharply back toward the origins of the rally, XRP won’t simply act as a relic of 2017; it will sport the matching haircut to prove it.”
The Spike stage of the pattern for XRP started on the exact same date and time as BTC’s. Prices surged aggressively from $1 up to $1.52 by August 22. Since then, it has traded within the Flat Range phase while sloping downward, lingering around $1.32 at the time of publication.
Frank Hepworth, CEO and founder of New Market Trading, interprets the current chart as a distinct warning sign, labeling the Bart Simpson formation as a textbook distribution setup where large investors offload holdings onto retail buyers.
Hepworth pointed out that “Bart’s hair” formed as bitcoin repeatedly encountered resistance at its 50-week moving average close to $81,000, a threshold he defines as the “last line in the sand” for bears. Because bitcoin failed to break past that barrier, Hepworth cautions that the market could slide back toward $70,000, or even drop to $58,000 if selling pressure accelerates, driving his organization to scale down its market exposure.
Bolstering the bearish perspective on XRP, Hepworth warned that XRP faces heightened susceptibility to a severe sell-off on account of its deteriorating relative strength against bitcoin.
With the XRP/BTC ratio falling back beneath its 20-week moving average, Hepworth anticipates XRP to underperform bitcoin in the event of a market correction. If bitcoin drops back toward $70,000, Hepworth forecasts XRP could decline between $0.55 and $1.21. Should bitcoin drop further down to $58,000, XRP could plunge as low as $0.46.
Originally published at https://www.coindesk.com/markets/2026/09/02/bitcoin-flashes-the-bart-simpsom-pattern-analyst-debate-whether-it-will-actually-form.