Oct 10, 2026, 1:43 a.m. EDT
5 min read

Summary
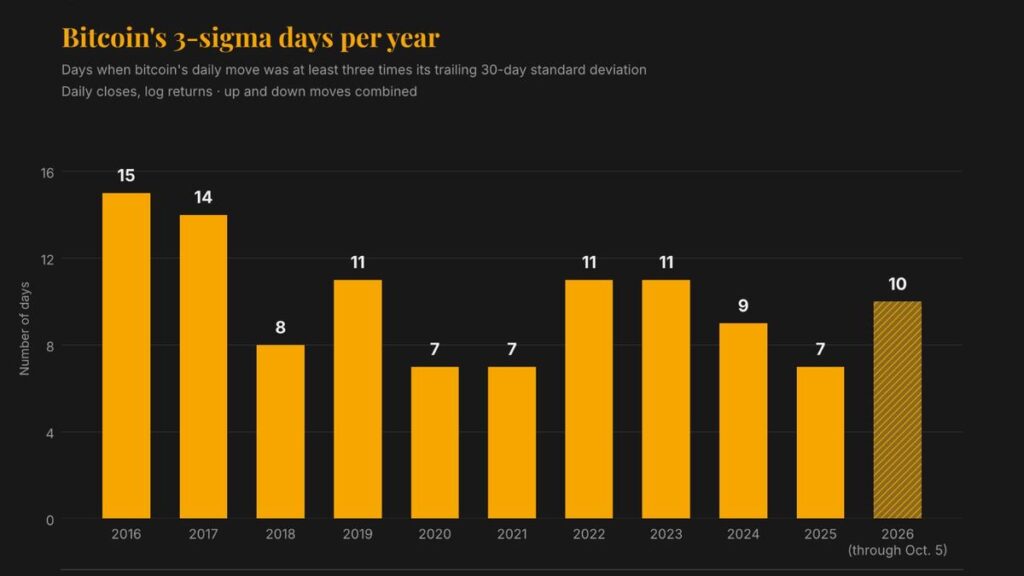
- Bitcoin has recorded 10 three-sigma trading days in 2026, exceeding the eight seen during the 2018 bear market, even as its annualized volatility has fallen to about 46% from 84%.
- The frequency of extreme moves suggests that standard value-at-risk models, which rely heavily on recent volatility, may understate bitcoin’s tail risk and encourage overly large portfolio allocations.
- Macroeconomic shocks and crowded derivatives trades can amplify sudden price swings, though deeper liquidity, stronger risk management and greater institutional participation have helped the market absorb them.
Bitcoin BTC $82,486.39 is encountering a higher frequency of outsized price fluctuations this year compared to the 2018 bear market, despite a steep decline in its general volatility, creating a significant hurdle for those depending on conventional risk models.
Based on an analysis by CoinDesk, the primary cryptocurrency has logged 10 instances in 2026 where its value shifted by a minimum of three standard deviations away from its recent trend lines. That figure surpasses the eight comparable sessions registered throughout the entirety of 2018, a period in which bitcoin dropped 73% in value.
Traders evaluate these uncommon movements using ‘sigma,’ a metric tracking the extent to which an asset’s valuation deviates from typical patterns. To measure this, CoinDesk contrasted daily price variations against bitcoin’s 30-day realized volatility, which tracks average daily movement over the prior month. Any session experiencing a shift at least triple that baseline, in either direction, was classified as a ‘3-sigma’ day.
Roughly 95% of fluctuations occur inside a 2-sigma boundary under a standard bell curve, while 99.7% remain within three. Such parameters render a 3-sigma event uncommon, giving traders a reliable metric to flag significant turbulence. A high tally shows an asset remains susceptible to abrupt shocks, despite a cooling of overall volatility.
These observations indicate that while bitcoin has stabilized over time, it still experiences extreme sessions, registering them more frequently this year than in 2018. Consequently, bitcoin is undergoing a greater number of unusually high deviations relative to its recent volatility measures, though the absolute size of those shifts has decreased. Annualized volatility for bitcoin sits near 46% currently, down from 84% in 2018, whereas average 3-sigma shifts hover around 7%, decreasing from roughly 10% eight years ago.
“Bitcoin still goes through long quiet stretches followed by sharp repricings, and that hasn’t changed. The market has matured, with more institutions, ETFs and much deeper liquidity, so the average day is calmer. But the shocks haven’t gone away: macro, leverage, positioning,” noted Nicolas Quatravaux, head of EMEA at Paradigm, a prominent institutional liquidity network focused on crypto derivatives.
This dichotomy stands out even when evaluated against alternate volatile financial instruments. Since 2024, bitcoin has displayed volatility comparable to Nvidia at approximately 47%. Nonetheless, bitcoin registered 26 three-sigma sessions over that timeframe, contrasting with eight for Nvidia. Meanwhile, the S&P 500 recorded 16, and gold saw 12.

Why falling volatility can mislead risk models
The persistence of extreme shifts creates difficulties for investors relying on volatility-driven risk frameworks to calculate their bitcoin asset weights.
Value-at-risk, or VaR, represents a widely deployed metric estimating potential portfolio drawdowns during adverse trading sessions. Certain VaR architectures depend heavily on immediate price behavior, meaning extended phases of peaceful trading can falsely present an asset as low-risk.
Consequently, declining 30-, 90-, and 180-day volatility readings for bitcoin might prompt market participants to expand their exposure. However, depending on how a specific model is built, that perceived risk reduction might fail to account for potential outsized drawdowns.
Such frameworks additionally pinpoint loss limits without projecting the potential severity of drawdowns past those boundaries. This phenomenon constitutes tail risk—the possibility of rare yet severe losses lying outside standard trading parameters. The recurring three-sigma fluctuations observed in bitcoin demonstrate why market participants must factor in these extreme scenarios, regardless of diminishing day-to-day volatility.
“Standard VaR measures do not properly assess the full tail risk, and this is one of the main reasons industry has been moving towards Expected Shortfall and similar measures, that do take tail risk into account,” explained Luuk Strijers, CEO of the digital asset options platform Deribit.
Expected shortfall evaluates the scale of drawdowns during the most severe sessions rather than solely tracking their frequency. Diverging from traditional VaR alone, this strategy assists investors in quantifying the potential damage of those catastrophic shifts.
“If tail risk is not considered in the portfolio targets, then a quieter bitcoin does encourage indeed a broader allocation in the portfolio, making sudden jumps have a greater impact in the portfolio,” Strijers stated.
He added that these 3-sigma risks can be hedged with bitcoin options.
Why the sudden swings keep coming
Market analysts attribute these high-VaR sessions to a volatile combination of unpredictable macroeconomic catalysts and highly leveraged options positioning.
Paradigm’s Quatravaux highlighted the current year as a prime illustration.
“It was a slow start, with money rotating out into tech stocks, and a string of DeFi hacks pushed people towards vol selling and structured products for yield. Then you get Trump, the Iran war, the Fed, and with everyone short vol in a range, one headline is enough to give you an outsized day,” he remarked.
In essence, vulnerability accumulates when traders wager on sustained price stability. That positioning involved shorting options—effectively trading insurance against sharp market moves—to capture the collected premium.
Such approaches function smoothly during tranquil market phases. Yet once macroeconomic news breaks and valuations face drastic shifts, those short sellers find themselves mispositioned, and their scramble to unwind positions can transform a routine movement into a major shock.
Alexander S. Blume, co-founder and chief executive officer at SEC-registered investment adviser Two Prime, pointed to a particularly widespread implementation of this strategy known as call overwriting. Investors sell call options on existing bitcoin holdings, sacrificing upside participation in exchange for consistent income generated by option premiums.
“I believe that, despite tempered volatility on the whole, the heavy increase in derivatives markets positioning allows for large moves to still occur somewhat frequently. At present, call overwriting is a highly crowded trade. When we see a move up, like the past month, it creates a short squeeze that amplifies the moves,” Blume noted.
A more resilient market?
The positive takeaway is that the ecosystem is absorbing these shocks more effectively than previously.
On September 21, marking the date of the most recent bitcoin 3-sigma jump, Paradigm handled a record-breaking $6.7 billion in options transactions.
“This time we haven’t seen or heard of any desk taking a bad hit,” Quatravaux observed.
“Participants are much more sophisticated than a few years ago, risk management has improved a lot, and there’s more institutional money in the market, so a tough month stays a tough month,” he added.
Nevertheless, market participants should not expect these dramatic movements to cease.
“They’ll stick around. Ten years of data shows these days haven’t gone away as the market matured, because macro shocks aren’t going anywhere,” Quatravaux concluded.
Related Assets
- 1
- 2
- 3
- 4
- 5
- 6
- 7
- 8
- 9
- 10
Originally published at https://www.coindesk.com/markets/2026/10/09/bitcoin-s-volatility-has-plunged-but-extreme-price-swings-are-more-frequent-than-in-2018.