Based on a traditional trading metric, Bitcoin (BTC) is displaying robust indicators that its most recent long-term bottom is already secured.
Key points:
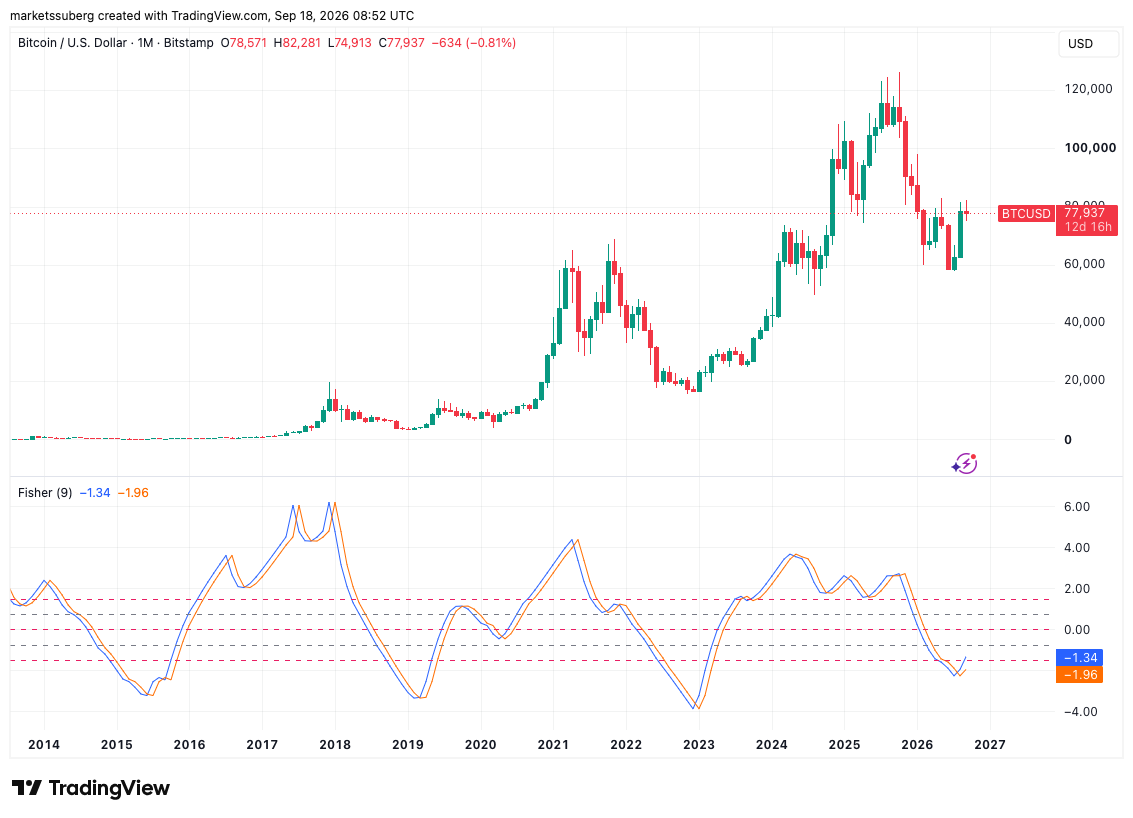
- Willy Woo points out that the Fisher Transform indicator printed a monthly bullish crossover in August, marking just the fourth instance in the history of Bitcoin.
- Earlier monthly crossovers coincided with the conclusion of Bitcoin bear markets, such as late 2022 when the Fisher Transform Indicator touched -3.83.
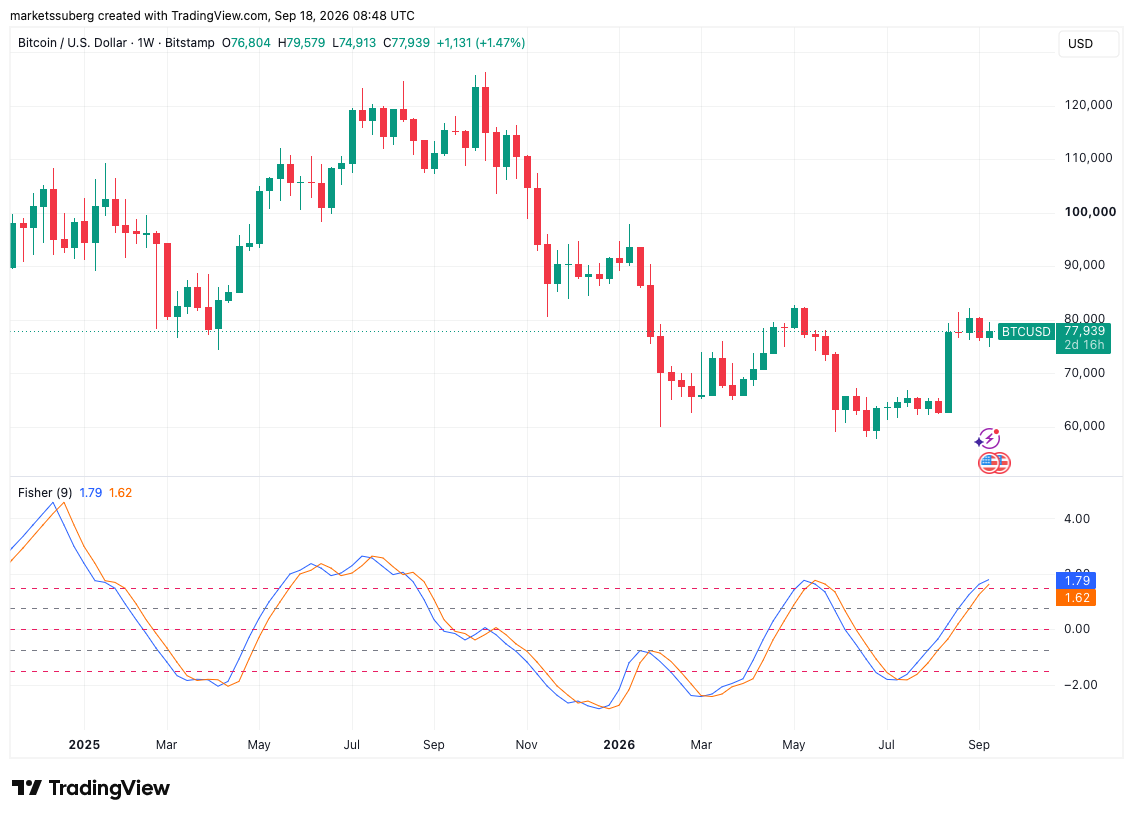
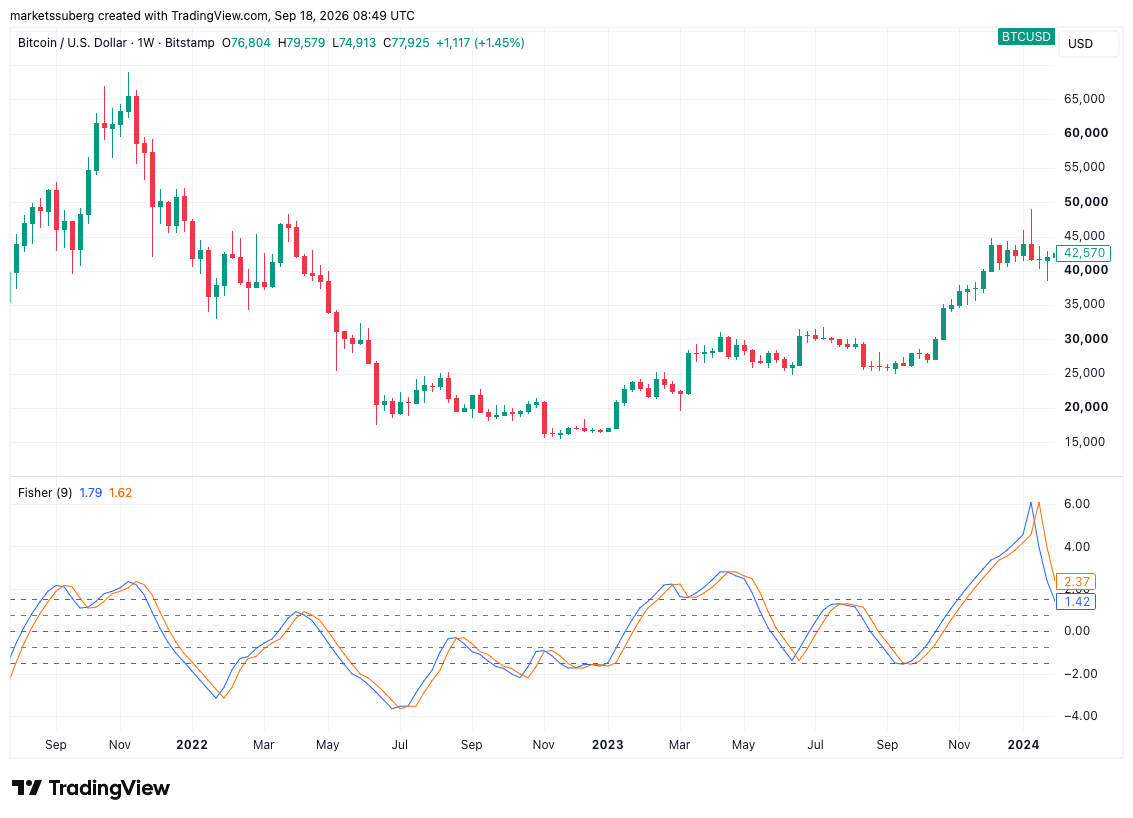
- Weekly timeframes continued to display a bullish divergence, mirroring the terminal phase of the 2022 BTC downward price trajectory.
Analyst sees evidence of clean BTC price reversal
In a thread published on X on Friday, market analyst Willy Woo highlighted essential readings derived from the Fisher Transform indicator, which is a price trend analysis instrument developed back in 2002.
This indicator smooths out the price activity of an asset to construct an easily interpretable trend-strength graph. Market quotes usually linger around extreme figures longer than standard statistical information does, and the Fisher transform mitigates this by applying a logarithmic transformation.
Composed of two trend lines—the Fisher line and the trigger line—the indicator oscillates across a scale centered at zero, where the trigger line originates from the Fisher line with a lag of one period.
Woo demonstrates that for Bitcoin, a sharp upward turnaround in the Fisher indicator, demonstrated when both trend lines cross over one another, has historically aligned with bear-market troughs when evaluated on monthly charts.
“BTC bottoms: 3 for 3 without fake out. Latest cross is the 4th on record,” he observed.
BTC/USD one-month chart with Fisher Transform data. Source: Cointelegraph/TradingView
The specific crossover transpired in July at -2.26, and should historical precedent hold true, BTC/USD is positioned to initiate a fresh macro upward trend. Nonetheless, Woo mentions that prices could still undergo consolidation and push lower, pointing to a comparable occurrence during past bull cycles when the Fisher indicator generated a bearish crossover prior to establishing a subsequent bullish one.
He attributes this behavior to the presence of speculative traders during extended BTC bull markets, who sway market momentum due to their sensitivity to short-term price fluctuations. Conversely, throughout bear-market bottoming periods, these speculators are largely absent, which enhances the dependability of Fisher bottom signals.
“When price falls to a point where investors find value, buy-pressure fires back up but we are devoid of speculators. Price reverses more cleanly without the choppy fake outs seen in tops. Hence bottoms are easier to define. This is seen in many signals, also seen in the Fisher Transform here,” he added.
Fisher bullish divergence tracks 2022 bear market
The weekly chart reveals another bullish Fisher formation developing throughout the course of 2026. In this instance, the indicator reached a swing low of -2.85 toward the close of December last year, while BTC/USD hovered near $90,000.
Related: Bitcoin treasuries buy just 5.9K BTC in three months as paper losses linger
BTC/USD one-week chart with Fisher Transform data. Source: Cointelegraph/TradingView
Ever since, the Fisher indicator has printed a sequence of progressively higher lows while the underlying asset price registered lower lows, thus forming a bullish divergence. An identical setup unfolded back in 2022, where a bullish Fisher divergence coincided with the final six months of the preceding Bitcoin bear market.
BTC/USD one-week chart with Fisher Transform data. Source: Cointelegraph/TradingView
Despite various onchain metrics triggering bear-market reversal signals over recent weeks, questions persist regarding whether Bitcoin’s 21-month low of approximately $57,000 recorded on July 1 truly signified a brand new cycle bottom.
In the previous week, Woo himself pointed out a scarcity of conventional buyer demand around those lows, with bid-side metrics indicating that only a select few large-scale investors were accumulating tokens at that juncture.
This article is published in alignment with Cointelegraph’s Editorial Policy and serves strictly informational purposes. It should not be interpreted as financial advice or guidance. All investments and market trades involve risk, and readers are advised to perform their own independent analysis.
Originally published at https://cointelegraph.com/markets/bitcoin-adds-to-bull-market-hopes-as-price-metric-prints-fourth-ever-bullish-cross?utm_source=rss_feed&utm_medium=rss&utm_campaign=rss_partner_inbound.