
Analyst Keith Alan notes that Bitcoin (BTC) might duplicate a set of bearish moving-average crossovers that came before its revisit of the $25,000 level in September 2023.
Key points:
- On Thursday, the 21-day simple moving average (SMA) for Bitcoin dropped beneath the 200-day SMA. Alan forecasts that the 50-day average will slide below the 100-day metric prior to the close of the week.
- Back in September 2023, these two crossovers occurred four days apart ahead of a test of the $25,000 support level by BTC/USD.
- Following Thursday’s technology sector sell-off on the day of Anthropic’s Nasdaq launch, Bitcoin slumped to a 20-week low of $61,231 on Friday.
Alan asserts that Bitcoin’s crossover formation “should not be ignored”
Fresh analysis courtesy of Material Indicators co-founder Keith Alan contrasts this week’s Bitcoin graphs with a comparable configuration from 2023.
On the daily Bitstamp chart for BTC/USD, the 21-day simple moving average (SMA) slipped underneath the 200-day baseline on Thursday. This action previously took place in early November 2025, roughly a month subsequent to Bitcoin reaching its newest all-time high of $126,200, during the initial phase of the ongoing bear market. The 50-day SMA crossed under the 200-day SMA later that same month, establishing a traditional death cross.
Alan anticipates that the 50-day SMA will drop under the 100-day SMA prior to the conclusion of the week.
In a statement published on X, he summarized, “We’ve only seen this happen once before in Bitcoin’s history, and it should not be ignored.”
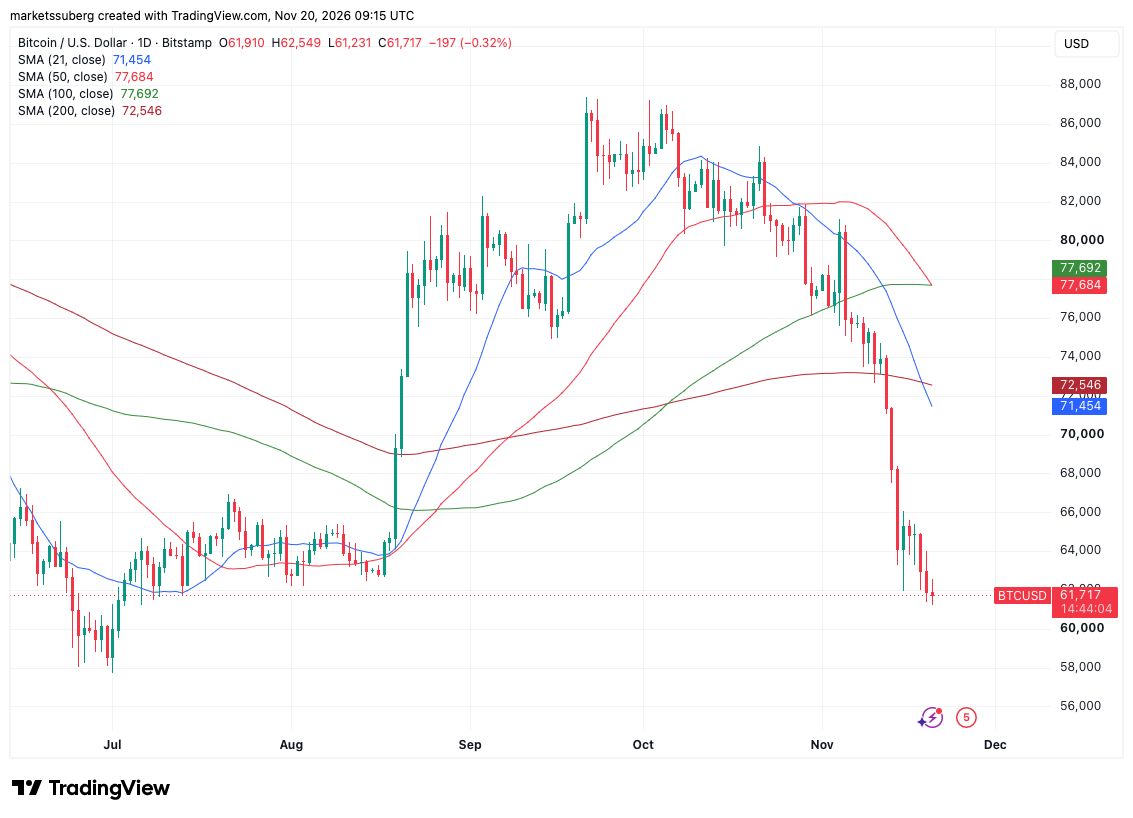
BTC/USD one-day chart with 21-, 50-, 100- and 200-day SMAs. Source: Cointelegraph/TradingView
The sole other instance in the history of Bitcoin where both pairs of moving averages formed a designated “death cross” within the same timeframe occurred across August and September of 2023. On September 11, BTC/USD tested support situated close to $25,000.
Alan characterizes this double bottom as the kick-off for an upward surge that drove Bitcoin toward its peak for 2023 at $44,700 by early December, marking an 80% gain.
He noted, “One occurrence is by no means a large enough sample to consider a reliable pattern, or expect similar returns/drawdowns, however the timing, placement, and candle characteristics have enough similarities that we can’t ignore it either.”
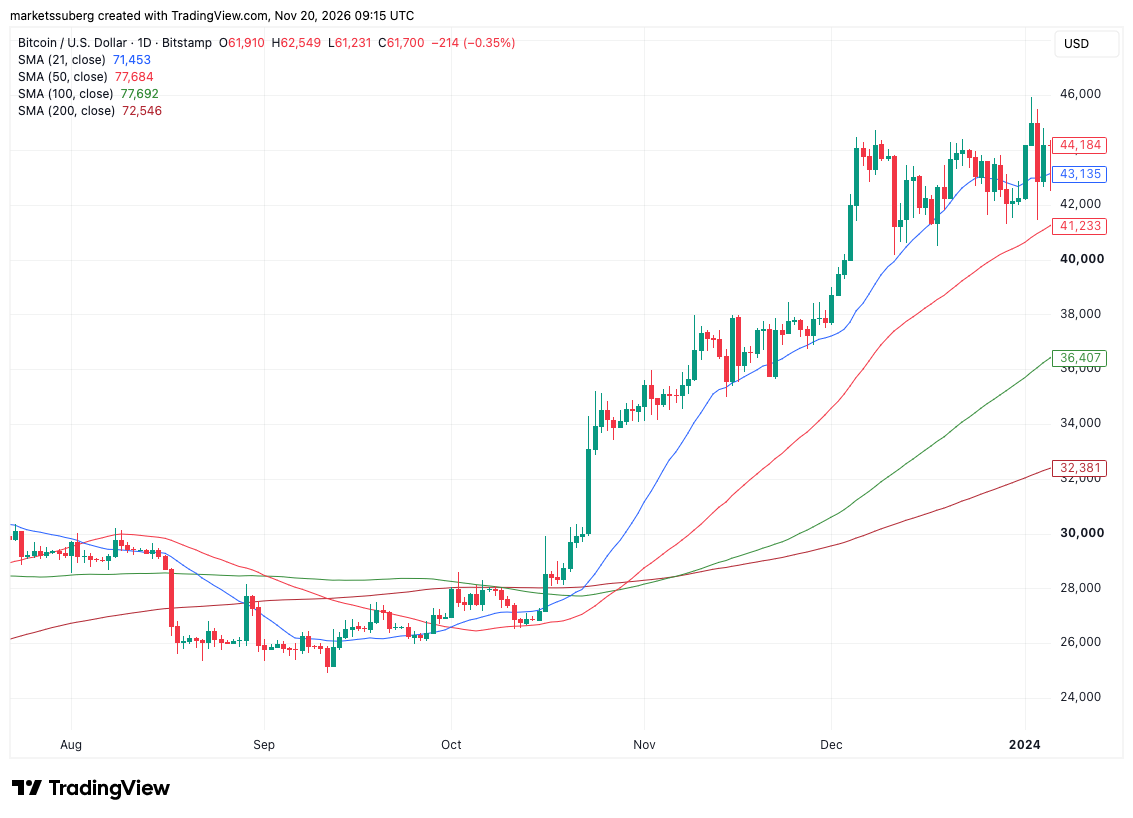
BTC/USD one-day chart with 21-, 50-, 100- and 200-day SMAs. Source: Cointelegraph/TradingView
The price of BTC registers a fresh 20-week low approaching $61,200
Previously, Cointelegraph covered Bitcoin dropping below support at the 200-week SMA for the initial occasion since mid-August. While this trend line customarily acts as a support zone during pullbacks in a bull market, it can transform into a barrier when prices attempt to recover from underneath it.
Related: Institutions pile back into US Bitcoin ETFs in Q3 after selling streak
On Friday, BTC/USD retreated to $61,231, marking its weakest point since July 3 and coming a day subsequent to Anthropic’s landmark IPO and debut on the Nasdaq. At the close of Thursday’s trading session, the technology-focused Nasdaq Composite Index dropped by 2.25% to finish at 23,879 points, representing its lowest daily close since April 14.
Ahead of Friday’s market opening, shares of Anthropic changed hands around $91.50. Thursday’s session concluded at $97.17, sitting 20% lower than the day’s peak of $115.
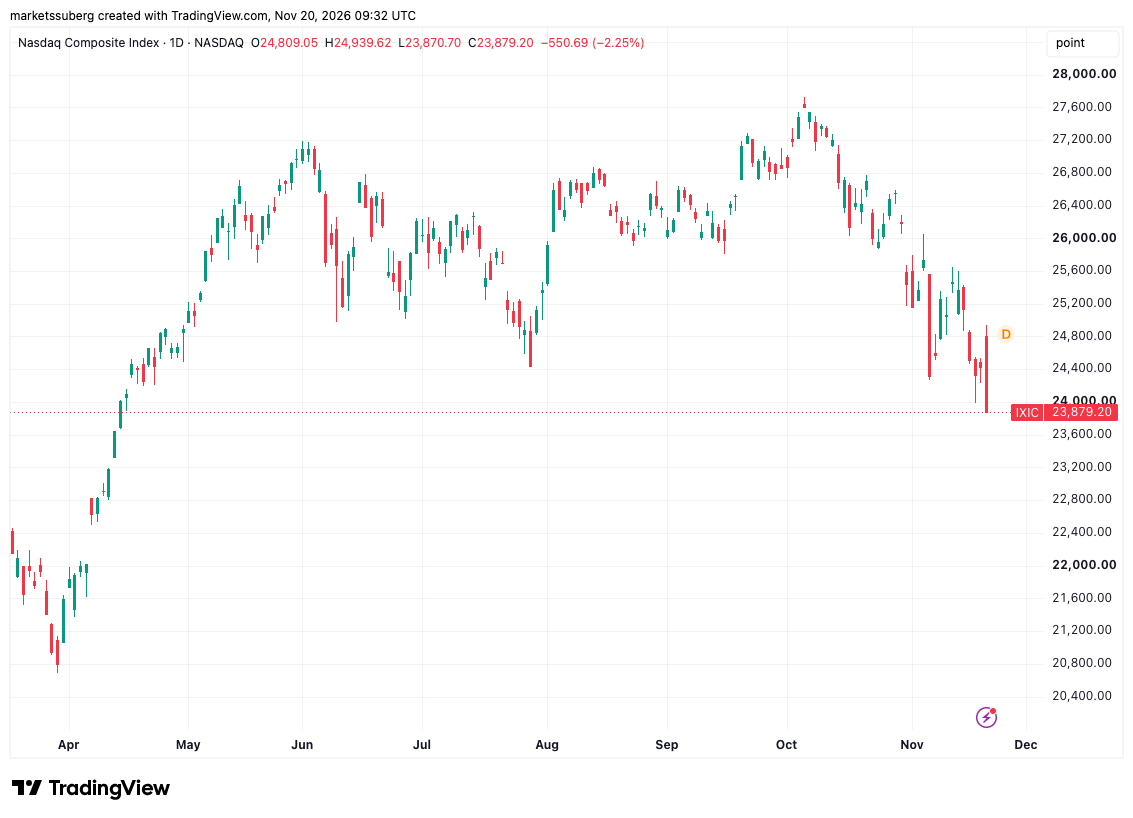
Nasdaq Composite Index one-day chart. Source: Cointelegraph/TradingView
Originally published at https://cointelegraph.com/markets/bitcoin-first-death-cross-repeat-2023-bottom-25k?utm_source=rss_feed&utm_medium=rss&utm_campaign=rss_partner_inbound.