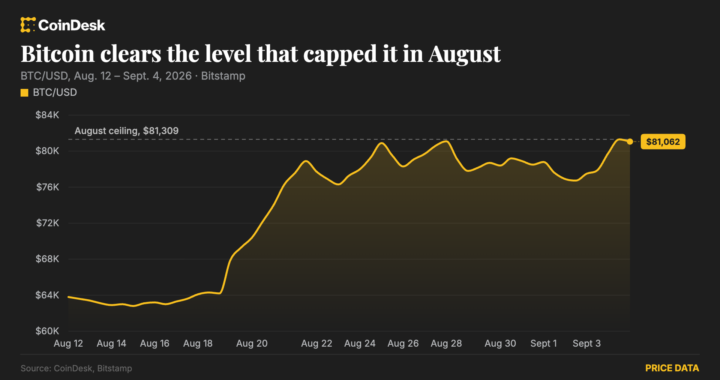
Bitcoin (BTC, around $77,819.21) is nearing one of the oldest bullish technical formations in financial trading. While its historical predictability remains mixed, the imminent crossover is receiving additional confirmation from USDT, the largest USD-pegged stablecoin by market capitalization.
The pattern in question is the golden cross. This technical milestone takes place when an asset’s short-term 50-day moving average crosses above its longer-term 200-day moving average. It demonstrates that near-term price momentum has outpaced the broader trend, frequently serving as an indicator of an extended bullish phase.
There is nothing intrinsically unique from a mathematical standpoint regarding the 50-day and 200-day intervals. These particular timeframes turned into standard market conventions because generations of traders began monitoring them across equities, fixed income, commodities, and ultimately digital assets.
Although it stands as one of the most widely followed bullish gauges, it faces regular criticism because moving averages reflect lagging price action rather than predictive data. As a consequence, the signal often triggers after a substantial portion of the rally has already taken place.
A Mixed Historical Record
Bitcoin’s historical track record with golden crosses reveals a much more nuanced narrative than an outright buy signal.
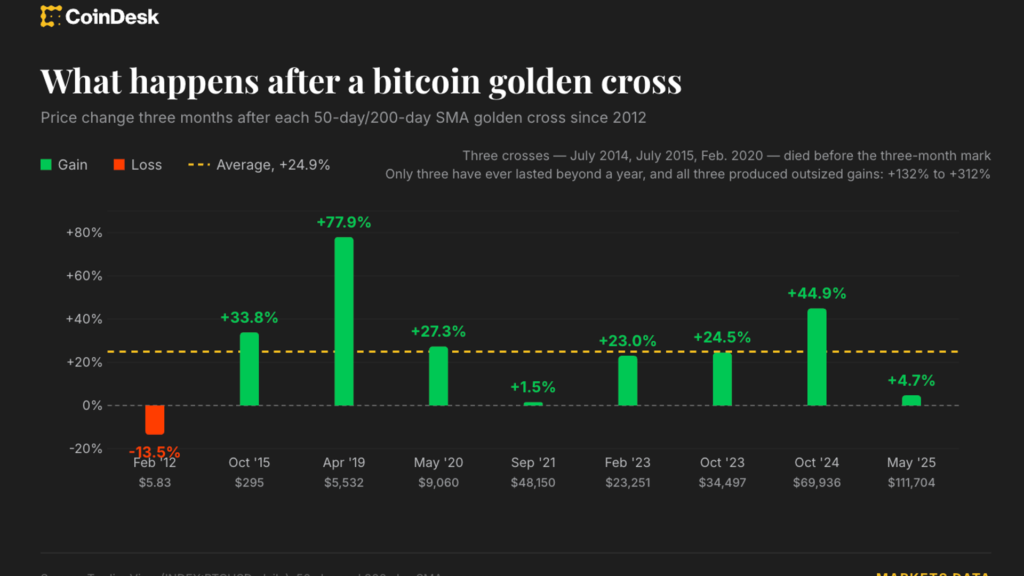
Since 2012, bitcoin has printed this specific technical formation—the 50-day moving average overtaking the 200-day moving average—on 12 distinct occasions.
Three of these occurrences sparked massive, enduring rallies. The initial instance, recorded on February 9, 2012, was followed by a 306% surge over the ensuing 12 months. An occurrence in October 2015 stayed valid for more than two years, carrying bitcoin toward its then-record high near $19,800 in December 2017. Another setup in May 2020 produced a 312% gain over the subsequent year, with bitcoin later reaching near $64,900.
Conversely, other signals faded too quickly to deliver substantial momentum. Two separate crosses in July 2014 and July 2015 were negated by a bearish death cross within two months of appearing, prior to even reaching a measurable three-month window.
A few later crosses generated strong three-month gains, in some instances surpassing 40%, only to be reversed by a death cross well before completing a full year. A signal in September 2021 barely rallied at all, recording an increase of just 1.5% before failing a few months later, shortly before bitcoin plunged more than 70% from its peaks over the course of the following year.
When aggregated, a distinct pattern becomes visible. Across the nine crosses where a three-month return could be assessed, the average advance was 24.9%. Nonetheless, only three out of the twelve crosses survived an entire year without being interrupted by a death cross, and among those three, the average 12-month return reached 250%. In short, the indicator holds a respectable track record over a three-month horizon, but remaining intact through a full year has been an exception rather than the norm.
USDT Dominance Rate
Whether this impending golden cross will hold remains to be seen. However, a separate market indicator is currently trending in a direction typically associated with rising crypto valuations.
USDT dominance calculates the circulating value of all Tether as a percentage of the total cryptocurrency market capitalization. A decreasing USDT dominance metric generally reflects risk-on sentiment: market participants are rotating capital out of the cash-equivalent stablecoin and deploying it into bitcoin and alternative cryptocurrencies. However, because dominance represents a ratio, it can also decrease when risk assets advance faster than new stablecoin issuance, even without direct outflows from USDT.
Historically, broad shifts in USDT dominance have coincided with major inflection points for BTC. For example, the dominance metric printed a golden cross in November of last year and subsequently rallied while BTC entered a downward trend.
That ratio is now nearing a death cross of its own, with its 50-day moving average preparing to drop beneath the 200-day moving average, according to TradingView data. Traders broadly interpret a persistent drop in USDT dominance as a risk-seeking indicator, as a larger portion of the broader crypto market’s capitalization sits outside of stablecoins.
Taken together, the approaching golden cross in bitcoin and the potential death cross in USDT dominance indicate that recent price momentum is accelerating while stablecoins occupy a diminishing share of the total digital asset market.
Originally published at https://www.coindesk.com/markets/2026/09/03/bitcoin-s-fabled-golden-cross-is-coming-and-usdt-may-be-the-real-signal-this-time.