Oct 8, 2026, 7:15 a.m. EDT
3 min read

This is an excerpt from CoinDesk newsletter ‘Daybook.’ Sign up here, if you haven’t already.
Just 24 hours after analysts stated that substantial capital inflows into spot exchange-traded funds are necessary to push bitcoin significantly past $87,000—a threshold that has capped recent upward momentum—metrics indicate market sentiment shifted in the opposite direction.
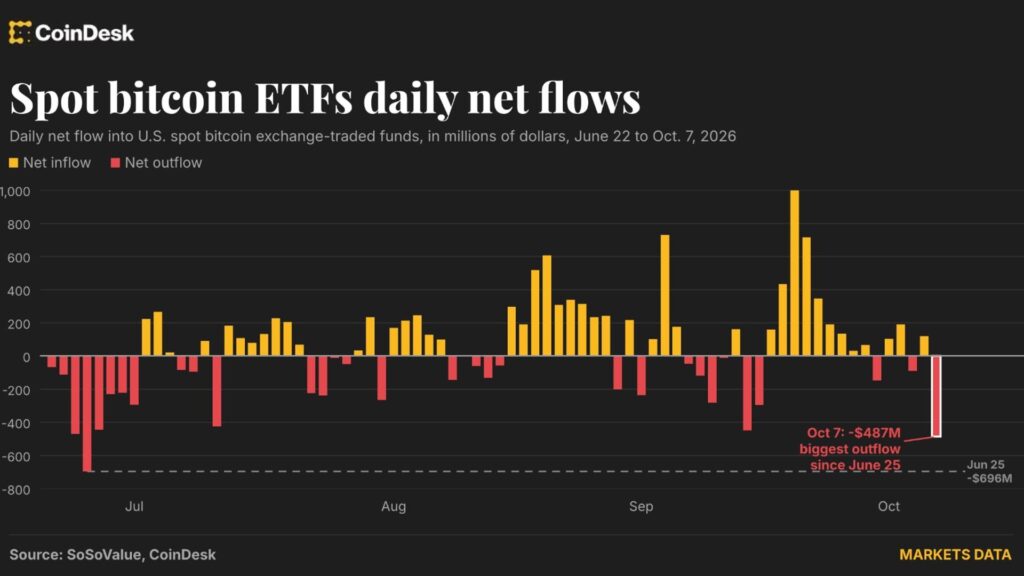
On Wednesday, U.S. spot ETFs recorded net outflows totaling $487.1 million, marking the highest volume since June 25, according to analytics provider SoSoValue.
Capital movement has experienced recent volatility. Following roughly $2.65 billion in net inflows throughout September, October has seen a net decline of $165.6 million thus far. The preceding six trading days alternated between minor inflows and outflows.
The withdrawal on Wednesday was exceptionally high, registering approximately 2.1 standard deviations below the 90-day average daily flow, which has hovered around $92 million in positive inflows, based on CoinDesk calculations. Under a normal distribution, roughly 95% of data points fall within two standard deviations of the average, making an extreme shift of this magnitude a rare occurrence.
Year-to-date, these financial products have accumulated $717 million in net inflows, maintaining a narrow buffer above zero, particularly after cumulative net flows reached a low point of $5.76 billion in outflows back in July. Total net inflows since trading commenced in January 2024 currently sit at $57.33 billion.
Presently, bitcoin changes hands near $83,000, hovering close to the support level that has persisted since the rally stalled on September 21. Market experts have warned that a confirmed breakdown beneath this zone would expose the $80,000 mark and invalidate the consistent bullish stair-step formation visible on daily charts.
The $80.5K–$81.5K bracket contains last month’s local peaks and the 50-day moving average. It may not prove difficult for bearish traders to drive quotes down into this zone, and it remains crucial to watch whether this level triggers bargain buying or forces participants utilizing margin to capitulate, explained Alex Kuptsikevich, chief market analyst at FxPro, via email.
In the first scenario, a rapid rebound toward recent highs is probable; in the second, a swift drop resembling a high-speed elevator toward $76,000 (recent lows) or $72,000 (the 200-day moving average) could occur, he added.
Unsteady Treasury yields continue to present potential headwinds, alongside escalating geopolitical tensions between the United States and Iran that threaten to drive up oil prices. Concurrently, softening spot ETF capital absorption, which acted as a primary driver during the August-September surge, could become problematic. Stay alert!
Read more: For analysis of today’s activity in altcoins and derivatives, see Crypto Markets Today. For a comprehensive list of events this week, see CoinDesk’s Crypto Week Ahead.
What’s trending
- Bitcoin loans are paying for tuition and working capital, not just trades, lenders say (CoinDesk): Bitcoin-backed finance is maturing beyond trading and increasingly resembles traditional lending, being locked as collateral against borrowing used to fund real-world expenses.
- Bitcoin breaks below $83,000 as oil jumps on Iran strike-plan report (CoinDesk): Bitcoin fell to under $82,800 while oil jumped on a report that the White House asked the Pentagon for strike options against Iran, pushing Treasury yields back toward their highest since 2002.
- Dollar holds near 18-month high, euro lags as bond yields rise (Reuters): The dollar edged towards its strongest level in 18 months, after minutes from the Federal Reserve signaled policymakers viewed inflation as the biggest risk to their outlook, while higher oil prices and rising eurozone bond yields weighed on the euro.
- Oil rise spurs fresh selling in stocks and bonds: markets wrap (Bloomberg): A rise in oil prices prompted a fresh round of selling in bonds and stocks as even a record profit from chipmaking heavyweight Samsung Electronics Co. failed to muster demand for riskier assets.
Today’s signal

The chart displays the daily price fluctuations of bitcoin using candlestick charts dating back to July. Superimposed is the 50-day moving average, illustrated by the yellow line.
BTC currently trades near the bottom boundary of its recent consolidation range. A definitive drop below this threshold would signal a bearish breakdown for the pattern, potentially triggering a selloff targeting the 50-day average at $80,550.
Related Assets
The Definitive Stablecoin Landscape Series: Asia Pacific
As stablecoins transition into regulated finance, the Asia-Pacific region is emerging as a critical testing ground. This report examines the region’s regulatory frameworks, adoption use cases, and the significance of RLUSD.
Why it matters: As stablecoins move into regulated finance, APAC is becoming a key proving ground. This report maps the region’s rules, use cases, and RLUSD’s role.
View Full Report
Originally published at https://www.coindesk.com/daybook-us/2026/10/08/bitcoin-etf-investors-head-for-the-exit-and-it-s-the-biggest-rush-in-months.